Performance Evaluation
To illustrate the performance of Gearpump, we mainly focused on two aspects, throughput and latency, using a micro benchmark called SOL (an example in the Gearpump package) whose topology is quite simple. SOLStreamProducer delivers messages to SOLStreamProcessor constantly and SOLStreamProcessor does nothing. We set up a 4-nodes cluster with 10GbE network and each node's hardware is briefly shown as follows:
Processor: 32 core Intel(R) Xeon(R) CPU E5-2690 2.90GHz Memory: 64GB
Throughput
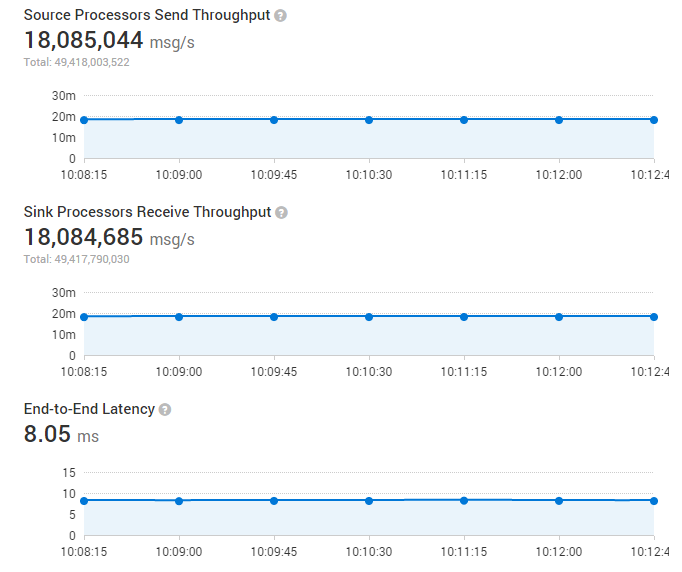
We tried to explore the upper bound of the throughput, after launching 48 SOLStreamProducer and 48 SOLStreamProcessor the Figure below shows that the whole throughput of the cluster can reach about 18 million messages/second(100 bytes per message)
Latency
When we transfer message at the max throughput above, the average latency between two tasks is 8ms.
Fault Recovery time
When the corruption is detected, for example the Executor is down, Gearpump will reallocate the resource and restart the application. It takes about 10 seconds to recover the application.

How to setup the benchmark environment?
Prepare the env
1). Set up a 4-nodes Gearpump cluster with 10GbE network which have 4 Workers on each node. In our test environment, each node has 64GB memory and Intel(R) Xeon(R) 32-core processor E5-2690 2.90GHz. Make sure the metrics is enabled in Gearpump.
2). Submit a SOL application with 48 StreamProducers and 48 StreamProcessors:
bin/gear app -jar ./examples/sol-2.12-0.9.0-assembly.jar -streamProducer 48 -streamProcessor 483). Launch Gearpump's dashboard and browser http://$HOST:8090/, switch to the Applications tab and you can see the detail information of your application. The HOST should be the node runs dashboard.